MISSING VALUE RATIO - DATA DIMENSIONALITY REDUCTION
ALL YOU NEED TO KNOW ABOUT DATA DIMENSIONALITY REDUCTION

Hello everyone, I hope everything is going well for everyone! Before you begin reading this blog please go through our third blog (STARTING WITH DATA SCIENCE) to become acquainted with the fundamentals of data science and what exactly we do in DATA SCIENCE.
Moving on, today's topic is one of the most googled data science problems, which I discovered and spontaneously thought of giving it a shot to make things easier to comprehend all in one.
Beginning the topic with a difficulty that practically everyone faces, whether they are a novice or an expert level data scientist.
PROBLEM: Consider dealing and working with a dataset of 1000 columns and rows to create a predictive model. Many factors can be associated in this sort of circumstance like many variables might be correlated, making it nearly hard for a data scientist to cope with it when working on a real-world problem.
So, to simply solve the above problem Data Dimensionality reduction techniques are used where we try to reduce the number of input variables in the training data while dealing with a huge volume of data sets.
WHAT IS DATA DIMENSIONALITY ?
In Statistics, dimensionality refers to the number of attributes in a dataset. Healthcare data, for example, is notorious for having a large number of variables (e.g. blood pressure, weight, cholesterol level). In an ideal world, this information would be represented by a spreadsheet, with one column for each dimension.
Discussing the issue here, dealing with such small datasets will not be an issue when the real deal is a large volume of data with approximately 1000 rows and columns? This is known as high dimensional data
DO YOU KNOW ABOUT THE CURSE OF DIMENSIONALITY ?
Working with high dimensionality data means dealing with issues such as overfitting, which is caused by the increased number of features. The model we built using machine learning helps us to predict future outcomes, but as the data set grows larger, the possibility of inaccuracy in prediction increases.
So this is where Data Dimensionality Reduction methods come in to help us reduce the number of features and errors.
The CURSE OF DIMENSIONALITY, as defined by the great mathematician R.Bellman in 1957, is a problem caused by the exponential increase in volume associated with adding extra dimensions to Euclidean space. In general, the more features you have in your model, the more errors you will encounter in the future.
DISADVANTAGES OF LARGE VOLUME OF DATA (HIGH DIMENSIONALITY)
1. Having too many input characteristics (I.E LARGE VOLUME OF DATA) causes problems for machine learning systems.
2. Having too many input features consumes a lot of space.
3. Too many input variables introduce the curse of dimensionality.
BUT WHAT EXACTLY IS HIGH DIMENSIONAL DATA? HOW CAN WE BE SURE THE GIVEN DATASET IS HIGH DIMENSIONAL?
High dimensional data is a dataset in which the number of features P exceeds the number of observations N, which is frequently represented as P >> N.
A dataset with P = 7 features and only N = 4 observations, for example, is termed high dimensional data since the number of features exceeds the number of observations.

HOW ANALYSE THIS HIGH DIMENSIONAL DATA ?
By simply Reducing the input of the data. The obvious question is, "How?", Are there any special approaches for dealing with high-dimensional data? Yes, indeed. Let's find out how.
1. MISSING VALUES RATIO TECHNIQUE :
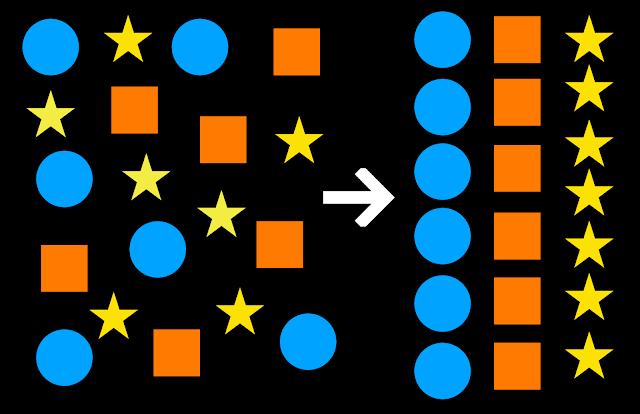
To make things simple, consider the following analogy.

We can see in the above image that some people are missing, but their place is not occupied, which is taking up double space. What if we cut out that empty space and tell them to stand accordingly, we can save the space.
MISSING VALUE RATIO is similar to the preceding analogy which states that:
1. When there are too many missing values in a dataset, we remove such variables because they provide no useful information.
2. To accomplish this, we can set a threshold level and drop variables that have more missing values than that threshold.
3. The greater the threshold value, the more effective the decrease.
HERE COMES THE CODING PART:


Comments
Post a Comment